Photo by Michael Förtsch on Unsplash
Crypto Market Analysis - Is the Market random or is there a favourable Side - Litecoin (LTC)?
This series deals with the question if the crypto markets follow the random-walk theory, or if the markets have a favourable side. More specifically we look at the data to find out, if there is a favourable side of the market i.e. if it is favourable to be on the long/short side for different cryptocurrencies. The analysis focuses on daily price data and we just look at the relation of up-/down-close candles.
The cryptocurrency I focus on in this article is Litecoin (LTC). Be wary to take this analysis with a grain of salt, as the data available might not be enough to extract actual valid information from the data. Further this must not be seen as financial advice.
Data Acquisition
Equally to the previous articles in this series I again used the Gate.io Exchange API to query the price data. See this article to find out more about how to get the price data and which exchanges are supported by the ccxt library. For Litecoin, price data is available all the way back to May 19th 2013. This means on the day this analysis is based (August 1st 2022), we have 3362 days of data available (May 19th 2013 - August 1st 2022).
Findings
The analysis, if LTC follows the random-walk theory or not, is structured equally to how the previous articles in this series were structured. First we are going to look at the split of Up, Down and Equal days followed by a deeper dive into the movement of LTC to see how LTC behaves after one/two consecutive down-close and one/two consecutive up-close days.
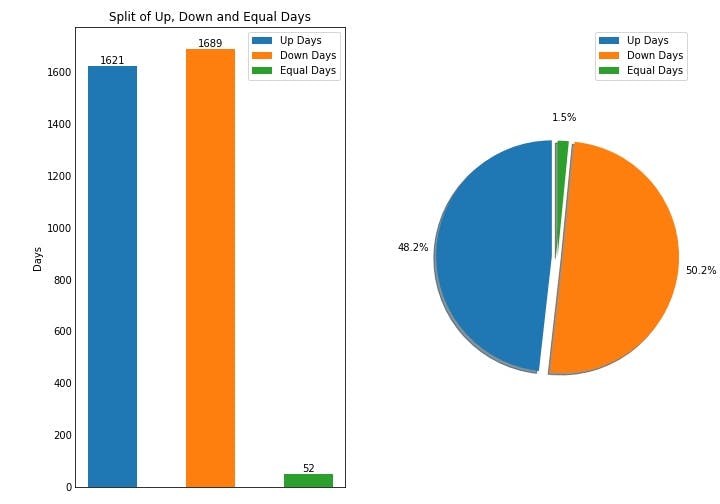
Lets start with the split of Up, Down and Equal days. In the graphic below you can see that the 3362 days of data are split into 1621 Up days, 1689 Down days and 52 Equal days. This means 48.2% of days were Up days, 50.2% of days were Down days and 1.5% of days were Equal days i.e. days were the opening price was equal to the closing price (the missing 0.1% is lost in rounding). This split of percentages is similar to the split which we saw for ETH, where the split of Up, Down and Equal days were in line with the random-walk theory i.e. the split of Up and Down days is very close to 50/50.

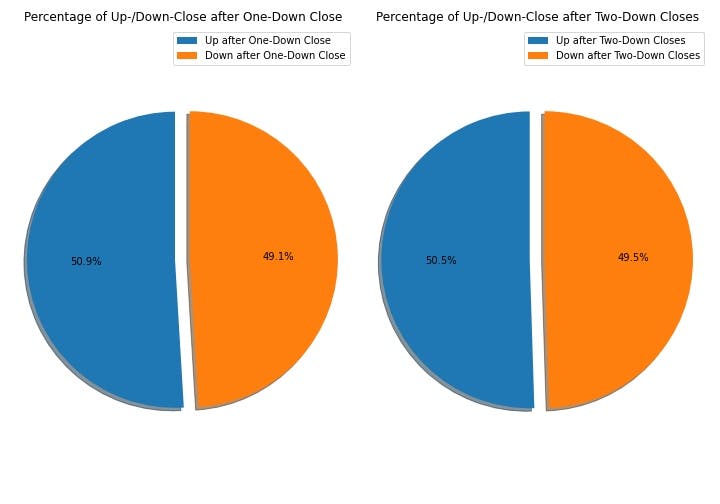
The second step now takes a closer look at the question, if LTC follows the random-walk theory, as if it does so we would expect price to not be influenced by the previous days movement. Therefore we look at the probabilities for an up/down-close day following one and two consecutive down-close days. The results are displayed in the figure below and as can be seen the probabilities for an up/down-close day following one and two consecutive down-close days are also equally split. This means, that in general, when LTC moves down the direction of the next candle is random.

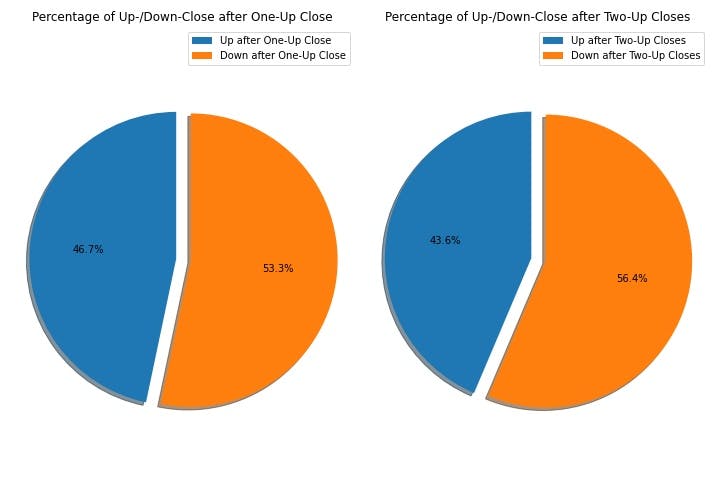
Up until now LTC shows random movement and everything so far points to LTC really following the random-walk theory, but as we looked at the behaviour of LTC's movement following one and two down-close days we have to look at the other direction as well i.e. what LTC does following one and two up-close days. The results for the analysis on the probabilities for an up/down-close day following one and two consecutive up-close days are presented in the figure below. Interestingly we see a skew to the downside for LTC with the probability for a down-close day following an up-close day coming in at 53.3% and the probability for a down-close day following two consecutive up-close days scoring even higher with 56.4%. This is very interesting, as up until now we have only seen skews to the up-side, but LTC shows a clear skew to the down-side.

Conclusion
We looked at the price data of LTC from May 19th 2013 to August 1st 2022 and looked at the movement of LTC to see if there might be a favourable side of the market, or if LTC's movement is truly random. Again we saw a split of Up and Down days, which supports the random-walk theory i.e. the Up and Down days are split 50/50. Where the analysis for LTC gets very interesting is when we look at the probabilities of up/down days following one and two up-/down-close days. The reason why I think it is very interesting is, that LTC shows a tendency exactly reverse to what we have seen up until now. More specifically LTC is the first cryptocurrency we look at, which has the short side as its favourable side, with the probabilities for an up/down day following one/two up days being skewed to the downside. Further this is the first cryptocurrency we look at, where the probabilities for an up/down day following one/two down days are split 50/50, supporting the random-walk theory.
So in conclusion, for me the percentages of an up-/down-close day following one and two up-close days point to the short side being the favourable side, which interestingly is the opposite to BTC and ETH.

